Daily Current Affairs for UPSC
Household Consumption Expenditure Survey (HCES) 2022-23
Syllabus- Economy [GS Paper-3]
Context
The National Sample Survey (NSS) Office has recently released the key results of the Household Consumption Expenditure Survey (HCES) 2022-23.
About
-
- The National Sample Survey Office (NSSO) under the Ministry of Statistics and Programme Implementation has been accomplishing household surveys on intake/client expenditure at certain durations as part of its rounds, generally of 1-year period.
- Since 1972, NSSO has been carrying out the Consumer Expenditure Survey.
- It is designed to gather statistics on consumption of products and services by the households.
- The survey pursuits at producing estimates of family Monthly Per Capita Consumption Expenditure (MPCE) and its distribution one at a time for the agricultural and infrastructure sectors of the country, for States and Union Territories, and for distinctive socio-economic groups.
- Methodology Used
- In the present survey, three three questionnaires had been used, protecting:
- Food items;
- Consumables and services items, and;
- Durable goods used.
- The survey had a separate provision for a series of records on the amount of consumption of the variety of items obtained and consumed by the fhouseholds free of cost through various social welfare programmes.
Changes in the Methodology
-
- First, there’s change in item coverage with inclusion of latest items and merging some of the obsolete objects. Overall, the range of objects blanketed has expanded from 347 to 405 objects.
- Secondly, there have been changes in the questionnaire of the survey.
- Instead of a single questionnaire as used in earlier surveys, HCES 2022-23 uses four separate questionnaires for food, consumables and services items, and durable goods, apart from a separate questionnaire for canvassing household characteristics to be used in three separate monthly visits in a quarter.
- Thus, there have been a couple of visits for statistics series instead of the standard exercise of a single visit in the latest surveys.
- Major Findings
-
-
- Increase in Income: The profits tiers of each the Urban and Rural families have risen as the closing survey, with Rural households showing a sharper increase in spending.
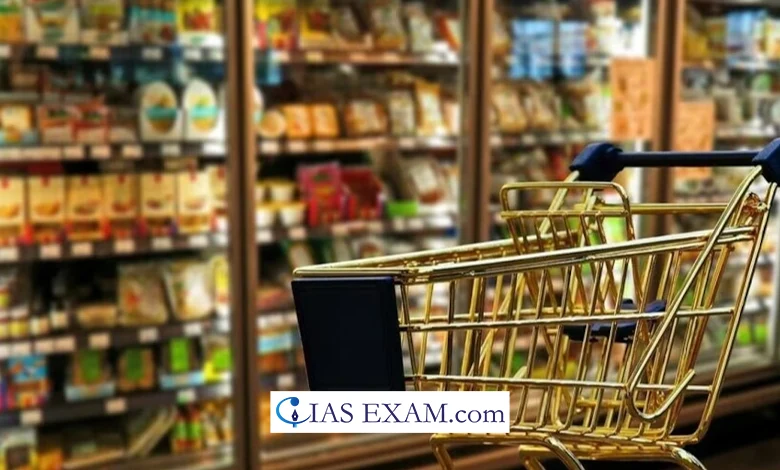
- Rise in MPCE: The common Monthly per capita consumption expenditure of both Urban and Rural households has doubled in the 11-year period with each spending less on food items.
- Of the full expenditure, 46% was spent on food items in Rural families and 39% in Urban houses in 2022-23.
- Spending extended in Rural Households: Household spending increased 2.6 instances in Rural areas and 2.5 times in Urban regions because the last survey in 2011-12.
- The gap between Urban and Rural family intake has narrowed, and Indian households have been spending more on non-food items.
- Gap Between Rich and Poor: The top 5% of India’s Rural population has 7 times the MPCE of the bottom 5% rural population.
- The top 5 % of India’s urban populace has 10 times the MPCE of the lowest 5 % Urban population.
- Among the States, the MPCE is the highest in Sikkim for both rural (₹7,731) and urban areas (₹12,105).
- It is the bottom in Chhattisgarh, in which it became ₹2,466 for rural families and ₹4,483 for urban family contributors.
-
- It may be inferred from the facts offered in the survey that:
-
- The distinction between Rural and Urban MPCE has narrowed significantly over the years, implying the success of government policies in improving Rural incomes.
- While the distinction is more pronounced on the lower tiers, the distance is larger at the top, reflecting an increase in inequality at higher income levels.
- The poorest Rural households have been able to spend at a much nearer level to their Urban Counterparts, implying that the government’s coverage projects for boosting Rural income have worked to an extent.
Source: The Hindu
UPSC Mains Practice Question
Q.In a given year in India, official poverty lines are higher in some States than in others because (2019)
(a) Poverty rates vary from State to State
(b) Price levels vary from State to State
(c) Gross State Product varies from State to State
(d) Quality of public distribution varies from State to State
Ans: (b)


.png)