Daily Current Affairs for UPSC
Global Multidimensional Poverty Index 2022

Topic- Economic Growth and Development [GS Paper-3]
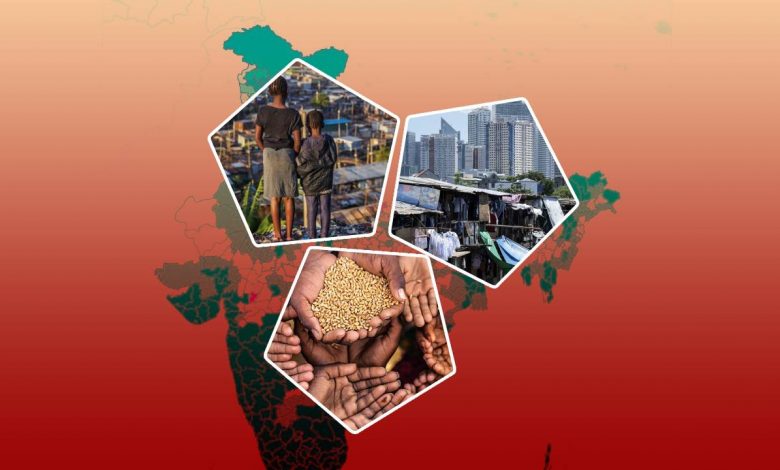
Context- Recently, the United Nations Development Programme (UNDP) and the Oxford Poverty and Human Development Initiative (OPHI) has jointly released the Global Multidimensional Poverty Index (MPI) 2022.
Key Highlights
- According to the Multidimensional Poverty Index, 1.2 billion people are multidimensionally poor.
- About half of those Multidimensional poor live in severe poverty.
- Half of poor people i.e. around 593 million are children under age 18.
- The number of poor people is highest in Sub Saharan Africa i.e. 579 million, followed by South Asia i.e. 385 million. These two particular regions together are home to 83% of poor people.
Indian Scenario
- As per the previous datas India has by far the largest number of poor people worldwide at 22.8 crore, followed by Nigeria at 9.6 crore.
- Two-thirds of the poor people in India live in a household in which at least one person is suffering from malnutrition.
- However the incidence of poverty fell from 55.1% in 2005/06 to 16.4% in 2019/21 in the country.
- The deprivations in all 10 indicators of the Multidimensional Poverty Index saw significant reductions as a result of which the MPI value and incidence of poverty has decreased to more than half.
- As many as 41.5 crore people moved out of poverty in India in between the 15 year period between 2005-06 and 2019-21.
- Improvement in the index for India has significantly contributed to the decline in poverty in South Asia.
- Thus South Asia now has not the lowest number of poor people than Sub Saharan Africa.
- Also the relative reduction from 2015/2016 to 2019/21 was faster with 11.9% a year compared with 8.1% from 2005/2006 to 2015/2016.
Performance of the states in India
- Bihar, the poorest state in 2015-16, has witnessed the fastest reduction in MPI value in absolute terms.
- The percentage of poor in Bihar fell from 77.4 % in 2005-06 to 52.4 % in 2015-16 and further to 34.7 % in 2019-21.
- Of the 10 poorest states in 2015/2016, only one state i.e. West Bengal has emerged out of the list in 2019-21.
- The rest of the states i.e. Bihar, Jharkhand, Meghalaya, Madhya Pradesh, Uttar Pradesh, Assam, Odisha, Chhattisgarh and Rajasthan still remain among the 10 poorest states.
- Across states and union territories in India, the fastest reduction in relative terms was seen among the states like Goa, followed by Jammu and Kashmir, Andhra Pradesh, Chhattisgarh and Rajasthan.
- Also the incidence of poverty fell from 36.6% in 2015-2016 to 21.2% in 2019-2021 in rural areas and from 9.0% to 5.5% in urban areas.
- Poverty among children also fell drastically in absolute terms, although India still has the highest number of poor children in the world.
- More than one in five children in India are poor in comparison to around one in seven adults.
Challenges for India
- India faces three rather acute and growing problems:
- Widespread unemployment,
- Widening inequalities and
- Deepening poverty
- None of these will be resolved by electoral victories. They require actual policy solutions. Without the right policies, India’s demographic dividend is looking more like a demographic bomb.
Multidimensional Poverty Index
- The Multidimensional Poverty index is a key international instrument that measures acute multidimensional poverty across more than 100 developing countries.
- The index was first launched in 2010 by the Oxford Poverty and Human Development Initiative and the Human Development Report Office of the UNDP.
- The global MPI prepares a deprivation profile of each household and person through 10 indicators spanning health, education and standard of living.
- All indicators of MPI are equally weighted within each dimension.
- The most common factors, affecting 3.9 percent of poor people, include deprivations in four indicators: nutrition, cooking fuel, sanitation, and housing.
- The MPI is calculated by multiplying the incidence of poverty and the average intensity of poverty.
- The MPI ranges from 0 to 1, where higher values imply higher poverty.
- The global MPI identifies people as multidimensionally poor if their deprivation score is measured as 1/3 or higher.
- By identifying who is poor, the nature of their poverty i.e. their deprivation profile and how poor they are i.e. their deprivation score, the global MPI complements the international $1.90 a day poverty rate, which was revised by the World Bank last month to $2.15 per day.
Dimensions and Indicators of MPI
The MPI monitors deprivations in 10 indicators spanning health, education and standard of living and includes both incidence as well as intensity of poverty.
- Health –
-
-
- Nutrition
- Child Mortality
-
- Education-
-
-
- Years of schooling
- School attendance
-
- Standard of living-
-
- Cooking fuel
- Sanitation
- Drinking water
- Electricity
- Housing
- Assets


.png)


